I build furniture and while I do my design work digitally for remote clients, I do my shop drawings by hand.
One super helpful tip I got from an actual trained draftsman is to use harder pencil lead for your layout and construction lines. Like 6H to 9H. You'll get a much lighter line to erase later. It'll also hold a finer point for longer.
I prefer lead holders to wooden pencils. They take 2mm lead, and you sharpen them with a lead pointer. K&E pointers are readily available on eBay, as are the abrasive cups that do the actual sharpening. The plastic trash can ones will get the job done, but are unsatisfying from a tactile standpoint.
A decent lead holder is a trick to find. The Alvin one I bought is too loose and the lead slips up into it. The Staedtler one doesn't close tightly at the tip and support the lead well enough to prevent breaking. The Prismacolor one is satisfactory, and I inherited a vintage one that I love from the aforementioned draftsman.
I recommend an erasing shield to make revising your pencil work without erasing too much. Another person I know with an art background tipped me off to putting tracing paper over your main drawing to iterate on details before committing them to paper to reduce erasing.
Drafting vellum is pretty forgiving of erasing, but it has a toothier surface that can get a little dingy if you're working on a drawing for a while. I've never tried Bristol board; I don't need immaculate drawings for reproduction, just good enough ones to build from.
Happy drawing. It's an immensely satisfying process for me. If you're detail oriented, you'll likely find it enjoyable too.
Finding tools that clicked was a nice process to discover. I also tried harder leads and like them for the reasons you mention - but for whatever reason, kept coming back to a basic BIC mechanical pencil.
An eraser shield is a good addition to the tools list - that came in handy often.
Love the tracing paper tip - that’d be helpful to remove the digital aspect of taking a picture a digitally sketching on top.
Yeah, you're working a little finer than I am. Drawing furniture full or half scale, I'm not too bothered by a thicker line as the pencil dulls. Drawing a graph, I'd probably want a more consistently fine line too.
I like the basic Pentel P205/207/209 pencils, but the basically disposable plastic Bics would probably be well suited to the short, brutal life they'd lead in the shop.
Loved the article and the joy of the process. The outcome is spectacular and shows the care that went into it.
I'm old enough that I took drafting in 7th grade. One tip I remember is to turn the pencil slightly as you use it. I think this was to help maintain the pencil's shape, but there my be other less obvious reasons.
I took woodshop too. The shop teacher seemed to enjoy scaring us with stories of the students that goofed off in shop to horrific consequences. That's also where I learned to be careful with air compressors around open wounds.
> That's also where I learned to be careful with air compressors around open wounds.
That sounds like you may have learned the same way I learned that 1: when a USGS topo map indicates an unimproved road, it may be out of date, 2: don't take your father's four-wheel-drive truck down a late-winter, corn-snow-covered dirt road when the temperature is starting to drop in the late afternoon 3: Don't go down a dirt road on a hill covered in corn snow without walking the path first to make sure you can get out or get back up. 4: When looking for a winter campsite for your Boy Scout troop, tell your parents where you're going.
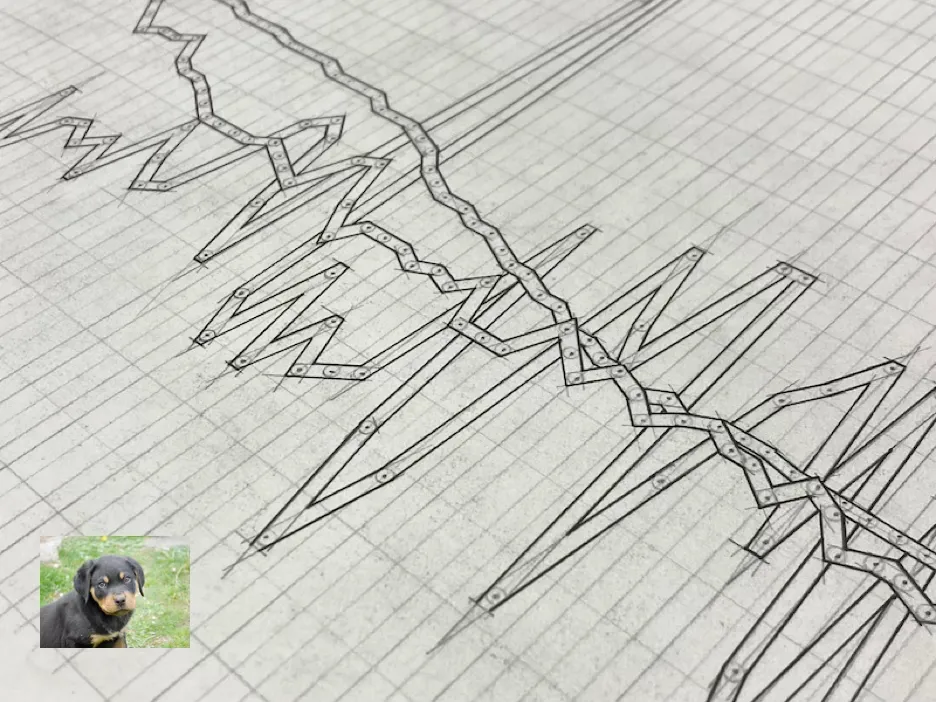
This should be a competitive sport, like gymnastics. He's attempting the bevel! With extra-wide lines! Very ambitious, but unfortunately he often fails to stick the corner alignments, the bevel distances are poorly controlled, and the data is unsuitably spiky for that choice of line joint. 7/10.
Amazing process (such patience in this day and age!), and special thanks for sharing links to the data viz books! Tufte was my gateway too but I didn’t think to look into books on technical sketching, engineering drawing, and draftsmanship.
Love hand-drawn viz, recently I’ve been looking at the French National Institute of Statistics and Economic Studies (INSEE) and they have a great collection of all their reports, from pre-1900s to now. I especially appreciate this beautiful one about people with mental illness in the Seine department… from 1889. The typography is chef’s kisshttps://www.bnsp.insee.fr/ark:/12148/btv1b52510983q/f49.item...
(After years of reading Hacker News this post motivated me to finally make an account and upvote. Data viz is so fun)
If you enjoyed this I'd highly recommend checking out A Semiology of Graphics[0]. I was a little surprised to not see it mentioned in the article, but I recognize the article was less about types of data visualization than it was about how we create data vis.
Thanks, the article puts into perspective the Bret Victor's point about William Playfair, who invented many of the data diagrams we use today, including the line graph. It was strange to see something as basic to how we think about data was invented only in late 18th century. But seeing the amount of work you put to design them properly clarifies the amount of creative thinking that was required to get something like this going on.
I'd also wish more graphs would come with this level of detail as this image from the article [0]. It would be so useful to see precisely where the data points are and how the line and interpolation are constructed.
The list of books was welcome, and the work is impressive. I always made do with section pad and a hard pencil and a simple stencil, but it wasn't for camera ready publication use or anything. Just visualisation and discussion.
My book suggestion is more illustration than technical drawing but still has a 1940s/50s vibe: Thinking with a Pencil by Henning Helms. Covers illustrations, tracing, tables, maps and diagrams as well as 3d sketches.
I gather that Tufte was influenced by John Tukey's 1977 book Exploratory Data Analysis which introduces the box and whisker plot, dot plot and so on.
As to software, another poster has mentioned Tikz (usually used with LaTeX) and yes it is amazingly flexible and can produce just about any kind of plot (or diagram) you want. But there are older tools such as the groff (GNU Troff) system's pic and a pre-processor for pic called grap which is much more barebones. The latter was also influenced by Tukey's book. The groff/pic/tbl/eqn/grap install is something like 30Mb and it is available in most Linux distribution package repositories.
Oh and remember star charts for astronomers! Many hand plotted before the photographic surveys were produced. Norton's Star Atlas is a famous one (prior to the 2000.0 epoch edition) that was hand drawn.
In the mid-2010s, I was interning at the German federal statistical office. Some of the team assistants were there since the 1980s/90s and had still learnt to use those tools as part of their vocational training.
They also showed me the tools and the instructions for drawing exactly aligned tables by hand and the resulting bound sets of tables with hundreds of pages. Completely mind-boggling how much time they must have spent on a single project, now all automated away.
Unfortunately I do not see specific discussion of how to make the lines a consistent thickness. It does have notes on how to sharpen your pencil and how to use a carpenters spline to draw smooth curves though.
Since I usually cannot spend 50 hours on a chart, I wonder why it is so hard to make decent graphs with the usual Office packages. They make it easy to create something and for others to contribute, but have really bad defaults. Even when you make the effort to adjust, you can still tell the program. And templating does not really work either.
And remember that perfection is the enemy of the good. I needed a little bit of drafting to design a sun room and started looking at software options. I didn't immediately like anything so I grabbed a ruler and a piece of paper and drew what I wanted pretty quickly using the standard 1/4"=1' scale. Precision is actually unimportant, everything will need to be fitted by the builder in the end, even if an architect measured and drew everything in AutoCAD/Revit. But very quickly you can get good results without even a drafting table and T-square. I have the T-square and triangles, but didn't have the space to work with them, and I'm happy enough with the result.
They look really good. I really enjoy looking at midcentury engineering charts/diagrams and stuff like jeppesen charts. NASA has a lot of good ones. The way the text looks, the line economy, the general aesthetic. Well worth the effort imo!
I'm glad I'm not the only who seemingly has a taste for "older" diagrams from that period. It makes me think of the same aesthetic roots of what's now called "cassette futurism" or "NASA-punk". Older engineering charts really feel like there was more care and thought put into each line or facet, even though I'm sure it's a trick of time.
What's been more interesting to me lately than using software to design data visualizations is learning to draw data by hand. It's a time consuming process but incredibly rewarding. The feeling of erasing graphite to reveal clean, crisp lines is something that software cannot recreate.
What do you use to erase pencil? The words "Using an eraser and a light touch" suggest a gum or a vynil eraser. I make a ball with the kneaded eraser and roll it with the palm against the paper.
I found myself using the Prismacolor Artgum eraser the most. It had a nice way of shedding the used parts and staying clean. I like the kneaded erasers too but I tend to dirty them up too much.
matplotlib has an xkcd style for a different sort of handmade aesthetic. And as reluctant as I am to bring this up as a comment to this post, “plot xyz and make the graph look like it was published in the financial times (but without ripping off their visual brand)” is a remarkably effective prompt after a little tweaking and I imagine something similar would work for other styles.
I teach digital art and am also a painter. When I was a student I loved filling sketchbooks with drawings - like a collection of ideas. To a large degree my web bookmarks and screen grab library have taken over this function. That being said, if I want to quickly communicate visual ideas to students or craftsmen I much prefer a paper and pencil. It feels so much more nuanced, comfortable and expressive.
I've taught digital art classes too. I was pleasantly surprised at a writing assignment where most students (un-prompted) turned in a hand-written response.
I ended up dropping my drawing class because I kept getting docked points for my handwriting no matter how much I practiced. I think I was on track for a B or C.